An Indicator for U.S. Coastal Extreme Sea Level
|
Lead PI: Thomas Wahl, University of Central Florida
Project Period: Sept. 2017 – Aug. 2020
Total Funding Amount: $266,473 |
Co-PI: Don P. Chambers
College of Marine Science University of South Florida Email: [email protected] |
Project Description.
The U.S., with close to 40% of the population residing in coastal counties and 17 port cities with populations in excess of 1 million, is particularly vulnerable to coastal extreme sea levels. Understanding how and why extreme sea levels have changed in the past and how they may change in the future due to changes in mean sea level (MSL) and storminess is crucial to plan effective and sustainable adaptation and coastal management strategies. In this regard, research on both MSL and changes in the storm surge climate (SSC) has mostly focused on quantifying, understanding, and ultimately projecting, long-term trends. This ignores the fact that there are substantial variations at decadal to multi-decadal time scales superimposed onto these long-term trends. These shorter-term variations have the potential to significantly increase or decrease the likelihood that flood-, erosion-, or other critical levels (e.g. salt water intrusion, ecosystem degradation, transportation interruption) are exceeded in a particular period. Therefore, it is important to also track, understand, and ultimately predict multi-decadal variations in MSL and storm surge water levels relative to centennial long-term trends at regional and local scales.
We propose to address this issue by developing separate indicators for multi-decadal MSL and storm surge variability which are then aggregated. Throughout the project we will use various physical observational data sets that are distributed and routinely updated by NOAA and other government agencies, including tide gauge observations and atmosphere/ocean reanalysis. Indicator time series will be obtained through filtering techniques and, in case of storm surges, state-of-the-art non-stationary extreme value models. The links to large scale climate change and variability will be established through multiple regression models and will be used to test to what extent climate models are capable of reproducing the observed decadal fluctuations. This will allow conclusions about the predictability of the aggregated coastal extreme sea level (CESL) indicator into the future. The new indicator can track and inform a broad audience about the current and potentially changing state of the two main physical drivers in the climate system affecting coastal flood risk. For 17 major U.S. port cities we will exemplarily demonstrate how the aggregated indicator modulates flood impacts.
We propose to address this issue by developing separate indicators for multi-decadal MSL and storm surge variability which are then aggregated. Throughout the project we will use various physical observational data sets that are distributed and routinely updated by NOAA and other government agencies, including tide gauge observations and atmosphere/ocean reanalysis. Indicator time series will be obtained through filtering techniques and, in case of storm surges, state-of-the-art non-stationary extreme value models. The links to large scale climate change and variability will be established through multiple regression models and will be used to test to what extent climate models are capable of reproducing the observed decadal fluctuations. This will allow conclusions about the predictability of the aggregated coastal extreme sea level (CESL) indicator into the future. The new indicator can track and inform a broad audience about the current and potentially changing state of the two main physical drivers in the climate system affecting coastal flood risk. For 17 major U.S. port cities we will exemplarily demonstrate how the aggregated indicator modulates flood impacts.
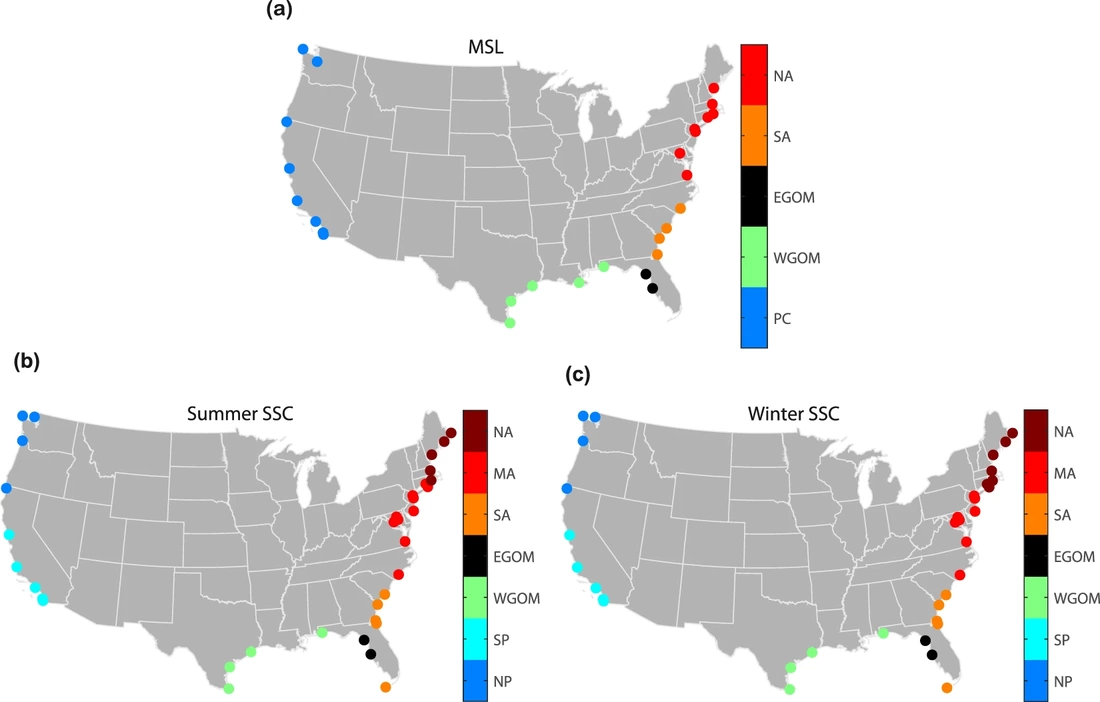
Regions of coherent MSL and SSC variability. Regions of coherent MSL variability (a) and SSC variability in the summer (b) and winter (c) half years (representing tropical and extra-tropical seasons) (PC: Pacific coast, NP: North Pacific, SP: South Pacific, WGOM: western Gulf of Mexico, EGOM: eastern Gulf of Mexico, SA: South Atlantic, MA: Mid-Atlantic, NA: North Atlantic). (Rashid et. al., 2019)
Throughout the project we will use readily available climate-related observations to create a tailored, informative, and applicable climate product, which is one of the main goals of NOAA’s Climate Monitoring (CM) program. Coastal change and extreme events, as potential indicator categories, and sea level, as a metric of public concern, are prominently highlighted in the U.S. Global Change Research Program’s (USGRP) Physical Climate Indicators workshop report (NCA, 2011). The proposed CESL indicator is aligned with several of NOAA’s broad societal challenge areas and long-term climate goals (1) changes in extremes of weather and climate, (2) coasts and climate resilience, and (3) sustainability of marine ecosystems. The new indicator will help communities to assess and mitigate flood risk and hence be of great public and inter-sectoral interest, including other federal agencies such as the U.S. Army Corps of Engineers (USACE) and U.S. Geological Survey (USGS), as well as USGCRP’s Adaptation Science Interagency Workgroup (ASIWG).
|
Funding agency/program: COM – Global Change Climate Indicators and Data Products for Enhanced Understanding (NOAA-OAR-CPO-2017-2004896)
|

|
Relevant Publications
Rashid, M.M., Wahl, T., Chambers, D.P., Calafat, F.M., Sweet, W.V. (2019). An extreme sea level indicator for the contiguous United States coastline, Nature Scientific Data, 6, 326, doi:10.1038/s41597-019-0333-x.
Rashid, M.M., Wahl, T., Chambers, D.P., Calafat, F.M., Sweet, W.V. (2019). An extreme sea level indicator for the contiguous United States coastline, Nature Scientific Data, 6, 326, doi:10.1038/s41597-019-0333-x.
|
|
|

|

|
Copyright © Coastal Risks & Engineering Lab, University of Central Florida, Orlando, Florida.
All Rights Reserved.
Website developed and maintained by Javed Ali.
All Rights Reserved.
Website developed and maintained by Javed Ali.
