MultiHazard R Package: Tools for Modeling Compound Events
|
The package contains functionality for pre-processing data including imputing missing values, detrending and declustering time series, as well as, analyzing pairwise correlations over a range of lags. In the bivariate setting the package allows for flexible modeling of the marginal distributions and dependence structure by using copulas, and, a range of parametric marginal distributions. It also provides tools for estimating joint probability contours and single “most likely” or ensemble of design events. The package also provides the capability for fitting and simulating synthetic records from three higher dimensional statistical models. Please follow the instructions in the vignette for further details on how to implement the package.
Reference: Jane, R., Cadavid, L., Obeysekera, J., and Wahl, T. (2020). Multivariate statistical modelling of the drivers of compound flood events in South Florida, Nat. Hazards Earth Syst. Sci., 20, 2681–2699, https://doi.org/10.5194/nhess-20-2681-2020. |
MATLAB Package: Non-stationary Storm Surge Indicator (NSSI)
|
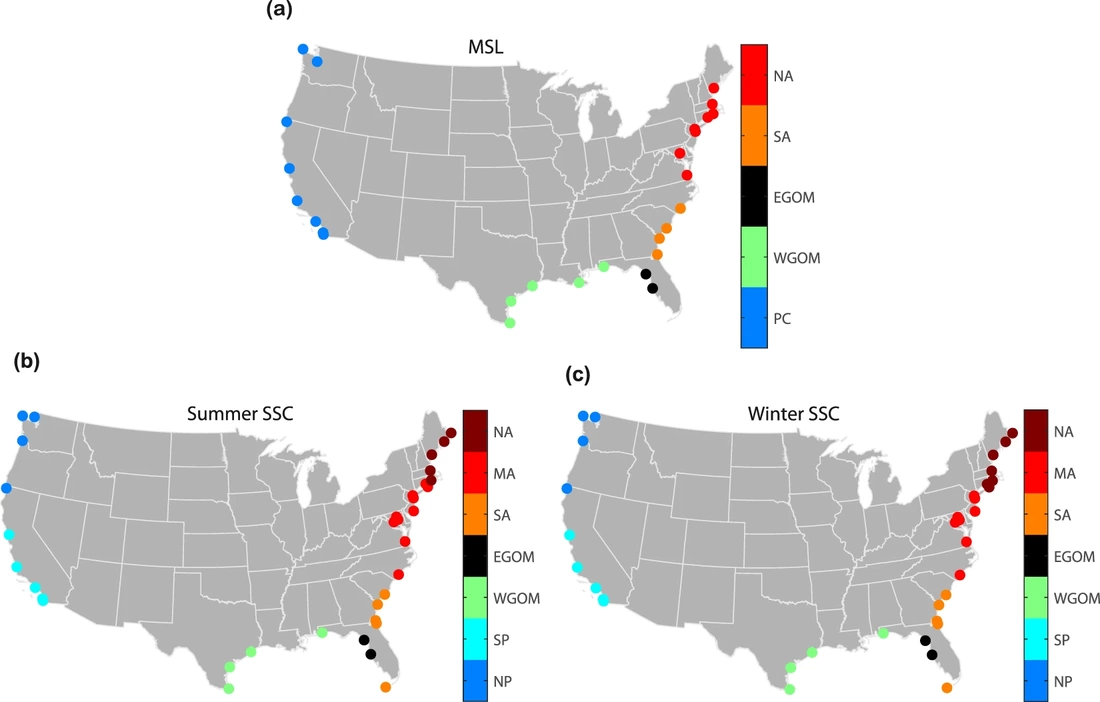
This package includes source codes/scripts for developing and analyzing of storm surge climatology (SSC) indicator, which were developed in MATLAB 2017b. This estimates storm surge climatology (SSC) indicator from tide gauge hourly sea level data. SSC indicator is the return sea level (e.g. 100 year) estimated by fitting a quasi non-stationary extreme value model to seasonal (i.e. two halves of the year: summer and winter) maximum sea levels. Software includes different functions/scripts written in MATLAB language. This also include a "ReadMe.txt" file for further details and to run the software.
References: Rashid, M.M., Wahl, T., Chambers, D.P., Calafat, F.M., Sweet, W.V. (2019). An extreme sea level indicator for the contiguous United States coastline, Nature Scientific Data, 6, 326, doi:10.1038/s41597-019-0333-x. Rashid, M. M., Wahl, T., Chamber, D. P., Calafat, F. M. & Sweet, W. V. Source code for extreme sea level indicators for the contiguous United States coastline. figshare, https://doi.org/10.6084/m9.figshare.8258912 |
Database: Extreme Sea Level (ESL) Indicators for the Contiguous US Coastline
|
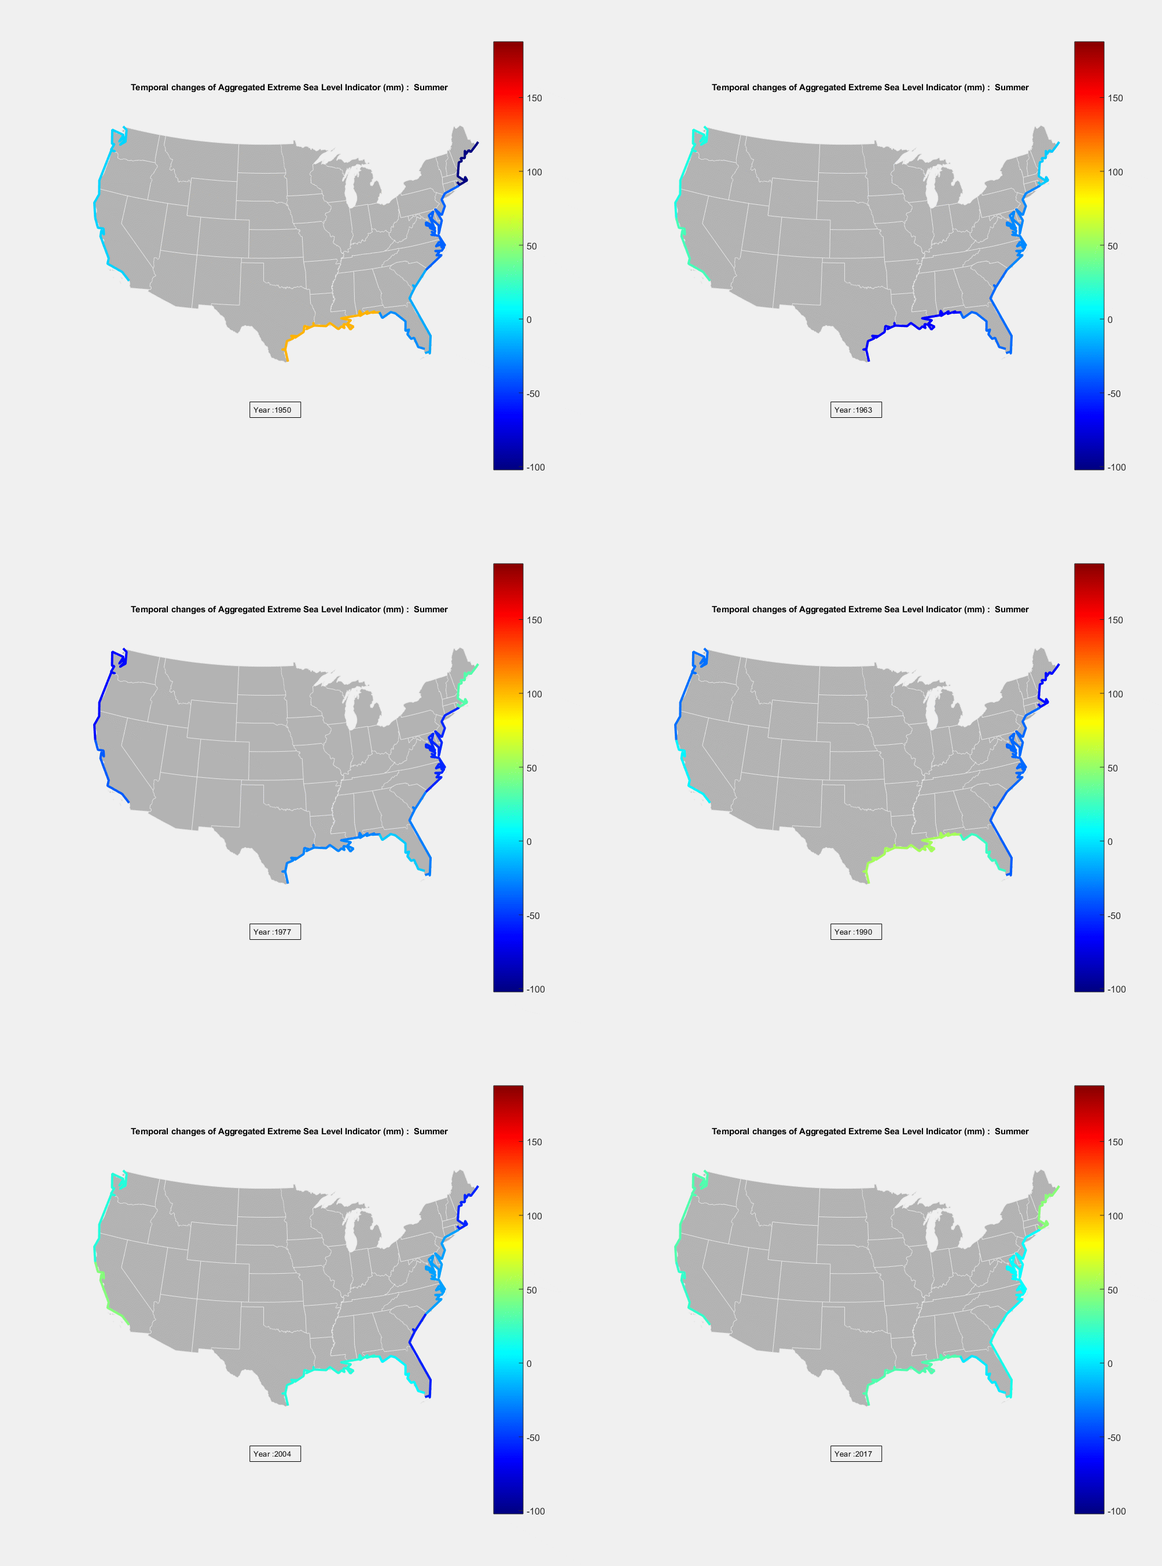
An Extreme Sea Level (ESL) indicator was developed for the contiguous United States coastline comprised of separate indicators for mean sea level (MSL) and storm surge climatology (SSC). ESL was derived by superimposing MSL, SSC, and long period tides, hence represent the combination of (i) the interannual variability of MSL after removing the influence of long-term global sea-level rise and vertical land motion, (ii) the multidecadal variations in SSC expressed as changes in the 100-year return sea levels estimated by nonstationary extreme value modeling after removing the MSL and long period tidal signals, and (iii) the fluctuations of the 4.4-year perigean and 18.6-year nodal tidal cycles. Database includes time series of MSL and SSC indicators. SSC indicators for different regions as well as series of combined 4.4 and 18.6-year tidal cycles are provided for summer and winter half year separately. Estimation of location, scale, and shape parameters of generalized extreme value distribution are provided. Two animation files those represent the changes of ESL over time are also included in the database.
|
References: Rashid, M.M., Wahl, T., Chambers, D.P., Calafat, F.M., Sweet, W.V. (2019). An extreme sea level indicator for the contiguous United States coastline, Nature Scientific Data, 6, 326, doi:10.1038/s41597-019-0333-x.
A Database of Global Storm Surge Reconstructions (GSSR)
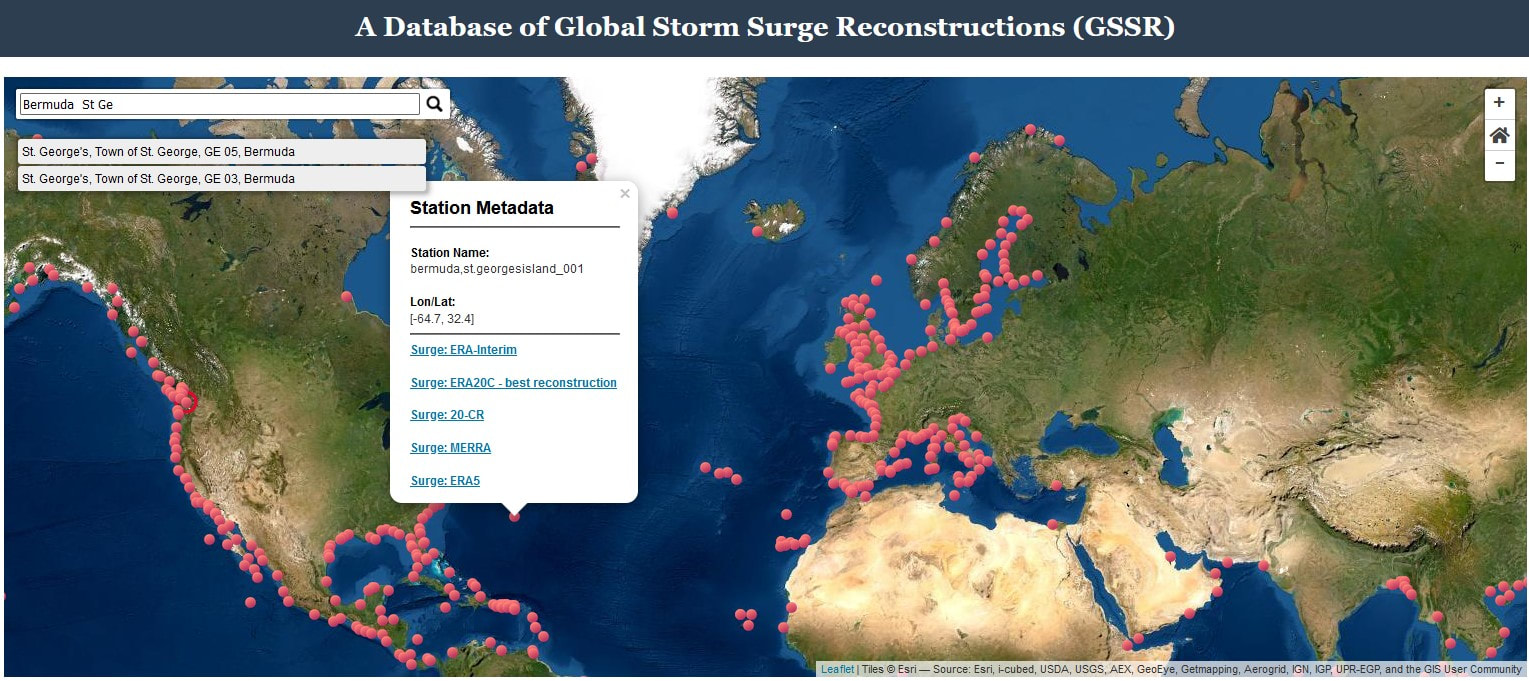
The Global Storm Surge Reconstruction (GSSR) database includes daily maximum surge values for the past at 882 tide gauges distributed along the global coastline. The data-driven models employed for the surge reconstruction were developed by Tadesse et al. (2020). We use five different atmospheric reanalysis products with different spatial and temporal resolution to produce surge information for the periods covered by the different reanalyses. The web-map allows the user to download daily maximum surge values for individual tide gauges and reanalysis products. The reanalysis that leads to the best validation results is marked with "best reconstruction" (note that in some locations data is not available for all reanalysis as there is no overlap in the periods covered by the tide gauges and the reanalysis).
|
Reference:
|
Tadesse M., Wahl T. and Cid A. (2020). Data-Driven Modeling of Global Storm Surges. Frontiers in Marine Science, 7:260. https://doi.org/10.3389/fmars.2020.00260
Tadesse, M.G., Wahl, T. (2021). A database of global storm surge reconstructions. Nature Scientific Data 8, 125. https://doi.org/10.1038/s41597-021-00906-x |
Copyright © Coastal Risks & Engineering Lab, University of Central Florida, Orlando, Florida.
All Rights Reserved.
Website developed and maintained by Javed Ali.
All Rights Reserved.
Website developed and maintained by Javed Ali.


